NetTraffic - screenshots
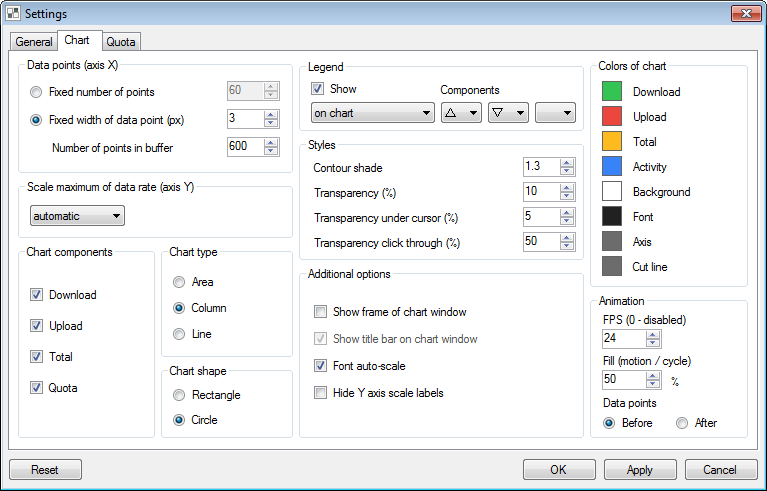
Charts
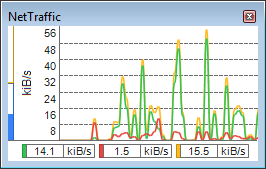
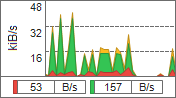
Design - rectangle / plotter
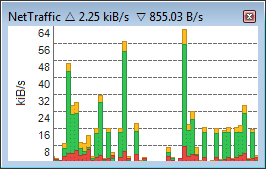
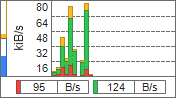
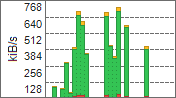
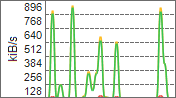
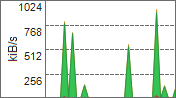
Columns
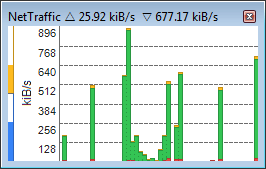
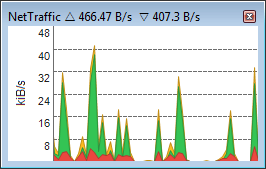
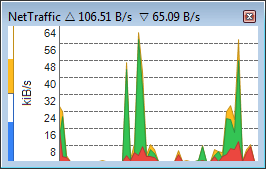
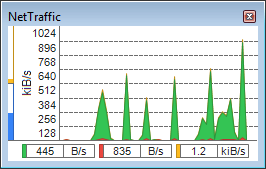
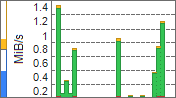
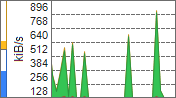
Area
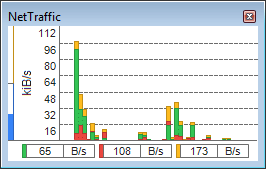
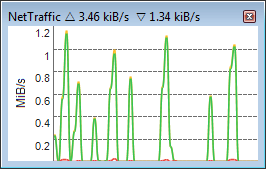
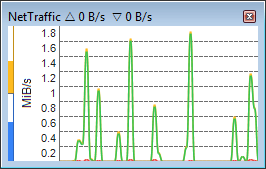
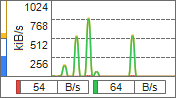
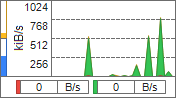
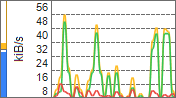
Lines
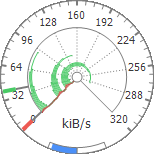
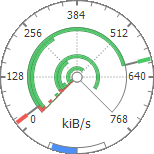
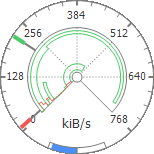
Design - circle / speedometer
Components
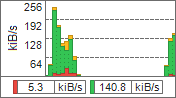
Legend, quota
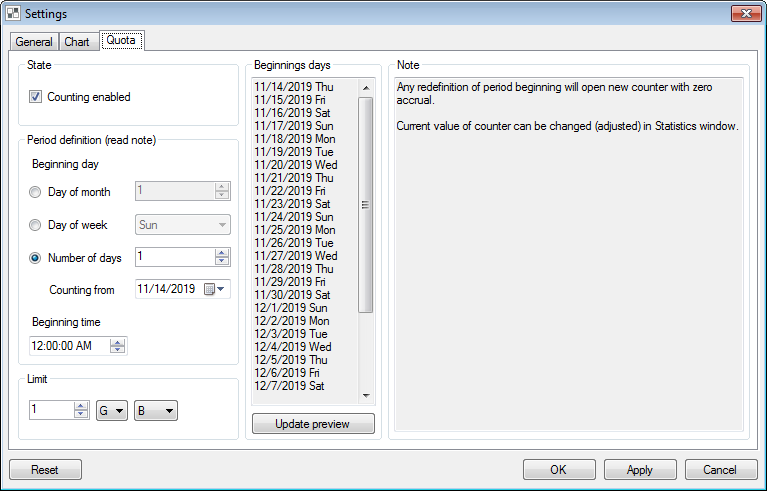
Quota
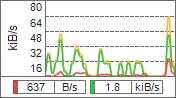
Legend
Off
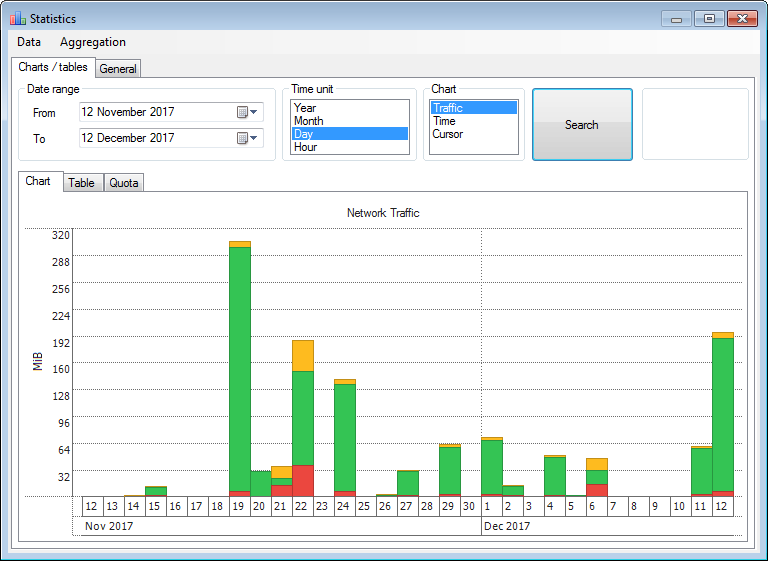
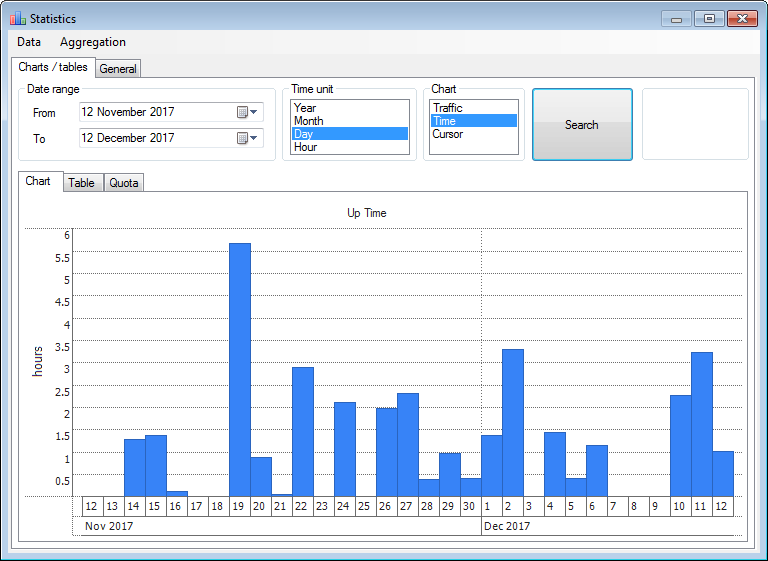
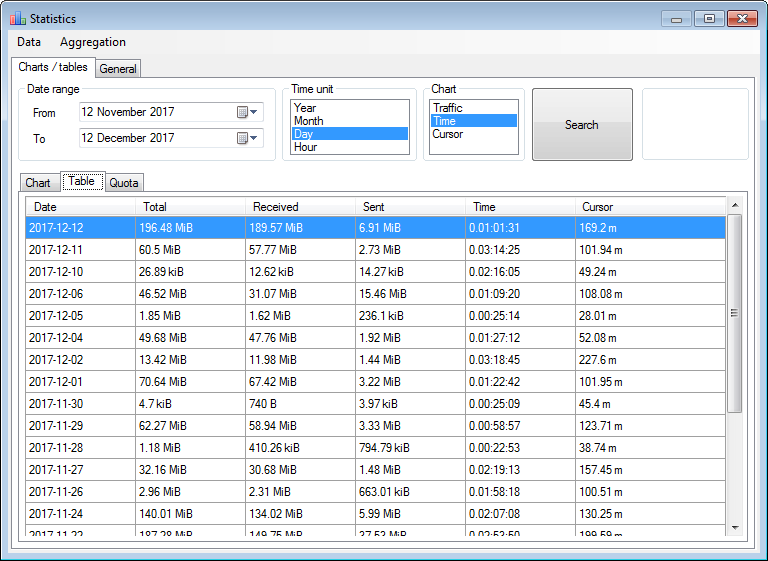
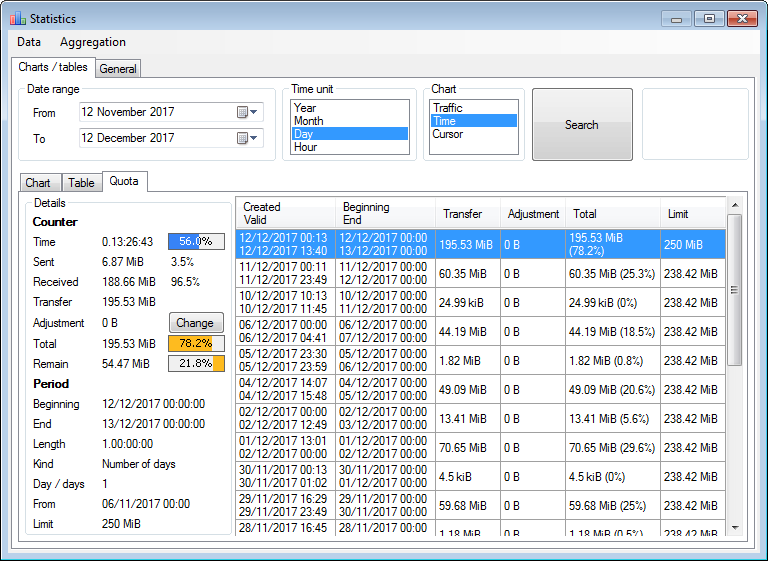
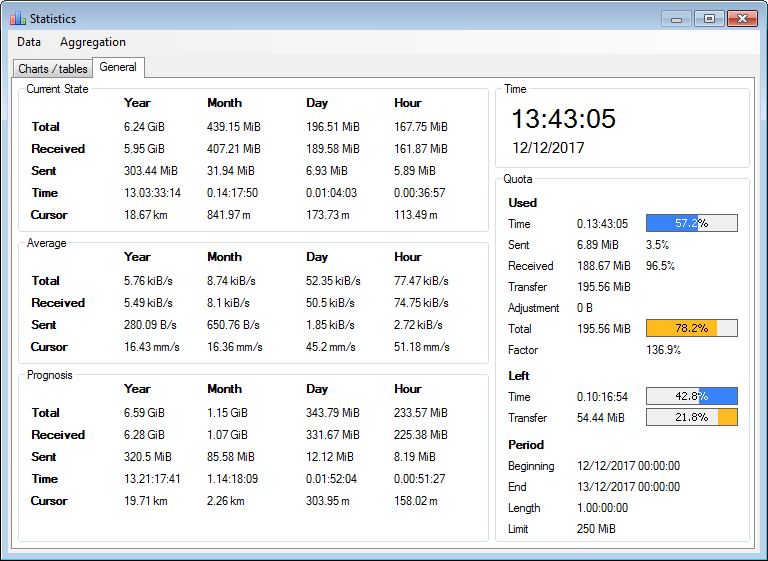
Statistics
Charts
Table
Quota
Summary
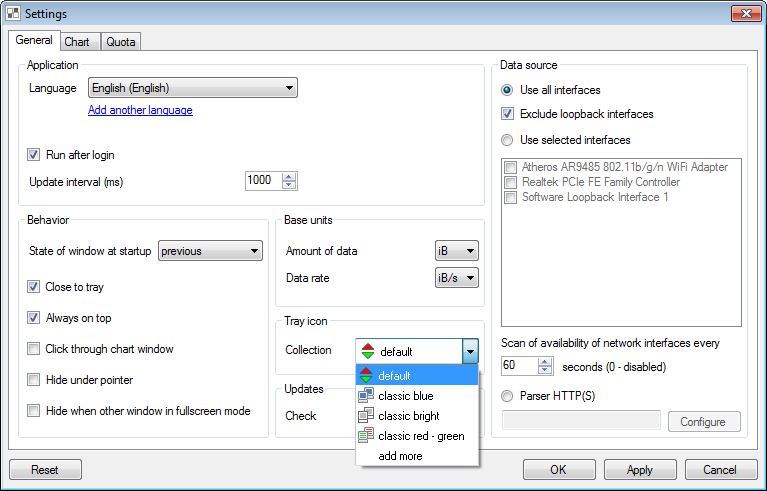
Settings
General
Chart
Quota
Configuration of HTTP(S) parser
.webp)
Module allow monitoring external devices (routers / modems / hosts). Data from parsing are used by live data rate chart, statistics and quota counter (if enabled).
Explanation of options and configuration here.
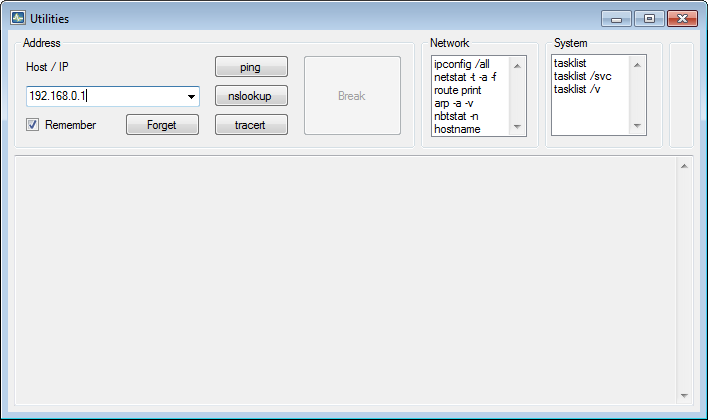
Utilities
Network utilities: ping, nslookup, tracert, ipconfig, netstat, route, arp, nbstat, hostname.
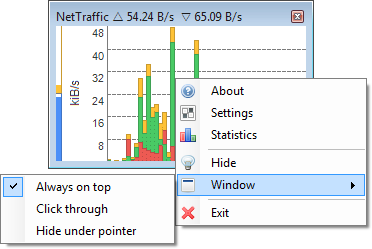
Context Menu
Accessible by right-clicking on chart or icon in tray.
Notify Icon

Quota usage indication
Top bar - limit usage. Bottom bar - lapse of period.
Go back.